
Looking Forward or Backwards?


Understanding how to use KPIs for management decisions.
By Rebecca M. DaVee, CPA, Partner, Salmon Sims Thomas
Numbers tell the story, always. Whether you are looking backwards “what was” or whether you can project operations forward “what if”, school administrators and owners use financial data to plan expansion or downsizing. Look at the two balance sheets listed below and see if you can identify the operational story:
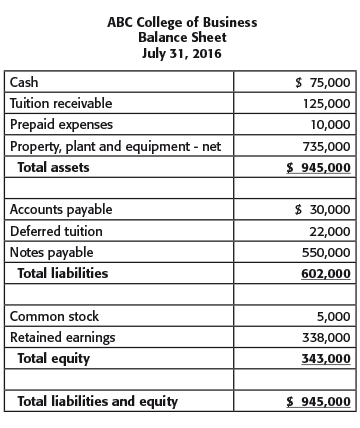
The story from this balance sheet tells the reader that the school has been recognizing profit since its incorporation and the profits have been invested in property, plant and equipment. The school obtained external financing to purchase the land and construct the facilities. However the school has a number of student receivables that need to be collected.
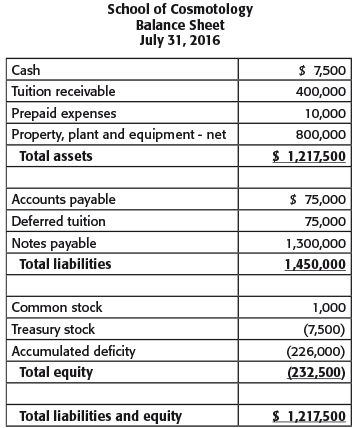
This balance sheet tells the reader that the school has had several years of operating losses because of the accumulated deficit included in total equity. The school’s cash balance is critically low because tuition accounts have not been collected. Total liabilities exceed total assets by $232,500, requiring management to determine how they will continue to pay vendors and operate in the near-term. The numbers tell the story.
Whether your school is a private or a public university or a career/vocational school, all educational entities should understand operational metrics. Key Performance Indicators (KPIs) or metrics provide trends and statistical data that tell the operational story. A metric is a “standard, of measurement” by which efficiency, performance, progress, or quality of plan, process or product can be assessed.
Schools have an operating cycle that is divided into units called semesters. During the semester, income is earned and expenses are incurred. Revenue can be deferred if billed or collected before the beginning of the semester or it can be refunded depending on the school’s student drop policy. Regardless of the beginning or end of your semester cycle – funds come in (tuition and fees) and funds goes out (payroll and other academic expenses). Trends develop over time and management can effectively navigate risks and opportunities by using and understanding KPIs. I’m sure you are using various financial reports to make management decisions. The effective metrics that schools can monitor for business success can be analyzed using the following seven KPIs.
- Active and future enrollment
- Current drops and refund liability
- Attendance rates
- Anticipated gifts, awards, and other financial aid
- 90/10 ratio
- Payroll versus total expenses
- Cash flow analysis
Active and future enrollment (KPI #1)
Schools can successfully estimate future revenues by tracking and projecting student enrollment. Enrollment is the strongest metric in analyzing tuition and related fees. If administrators understand what is fueling enrollment growth, then projected class sizes, programs and campus expansion can be evaluated. Short-term and long-term operating plans become reality if you understand the factors underling enrollment growth and decline.
School administrators can measure enrollment by campus, by degree program, or class by comparing enrollment numbers over the past five years. With those averages, school administrators can effectively forecast revenues. With an accurate estimate for future enrollment schools can affectively set goals (recruiting) and budgets (revenues and expenses) looking forward.
Here’s an example of how to apply this metric. Assume that a private business school has experienced the following enrollment in the last five years: 64,000 actively enrolled students over the past five years. Now – let’s drill down into the program enrollment activity to determine growth/decline:
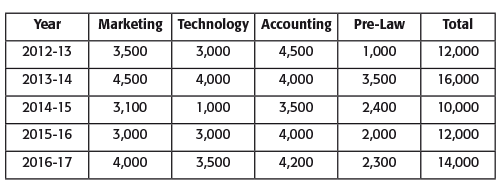
What does this information tell us? Marketing, Technology, and Accounting have held higher enrollment numbers than Pre-Law over the past five years. And although all departments faced declines in enrollment during the 2013-2014 school-term Marketing and Accounting have shown the highest growth over the last five-year period. With this information this school might consider expanding these programs, via online or additional campuses.
Current drops and refund liability (KPI #2)
Schools administrators should monitor their refund liability for projected enrollment drop rates. How accurate is your current model for projecting this liability? How can school administrators plan cash flow requirements based on current attendance and estimated current drops? Recording the refund liability is one thing, managing the cash flow requirements is critical. Students dropping classes might indicate the effectiveness of programs and/or professors.
Administrators should compare the historical drop rates for the past five years with total enrollment. Based on historical trends the school can project the estimated current drops and the related liability. Based on the projected liability the school can effectively manage funding the costs of the refunds.
Based on the information reflected in KPI #1, let’s look at the historical percentage of students that have dropped classes compared to enrollment.
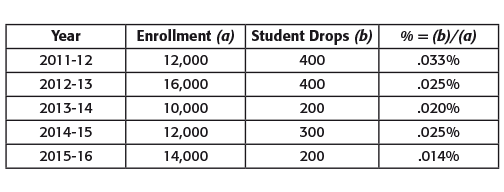
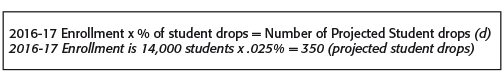
If there is a large variation in the number of student drops for a particular year, investigate the cause. Based on your review determine an average percentage of student drops. Now we can project the number of student drops for the current academic year as follows:
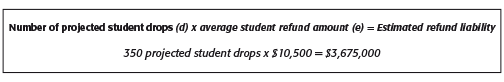
Now perform a similar exercise to calculate the projected average student refund liability:
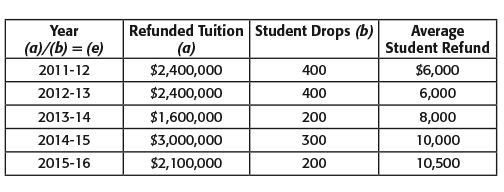
To be conservative you might use the largest historical average student refund to calculate the liability as follows:
Attendance rates (KPI #3)
When reviewing enrollment data administrators should also evaluate attendance rates by instructor, class, program, and campus. Is there a correlation between attendance and drop rates? Once administrators know what classes and instructors have successful attendance they can effectively plan their course offerings for future semesters. By building successful courses schools can project future enrollment, opportunities for growth, and academic development.
Anticipated financial aid (KPI #4)
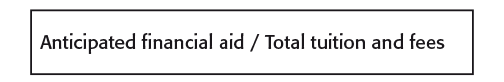
School administrators should understand the demographics of the student body by evaluating information provided by the student financial aid department. Students apply for financial aid and financial assistance is calculated for each student. This information is provided to administrators in order to budget the financial aid revenue for each academic year. Funding from the Department of Education (DoE) requires compliance with recordkeeping and reporting of financial information. If schools receive Title IV funding, management can monitor and anticipate financial aid with amounts collected so that the school complies with the 90/10 rule. The anticipated financial aid metric is calculated as follows:
90/10 ratio (KPI #5)
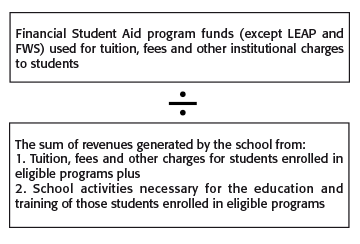
The 90-10 rule or ratio is a federal law barring proprietary colleges from receiving more than 90 percent of their revenues from Department of Education Title IV federal student aid, which includes student loans and grants. The law requires proprietary colleges to have at least 10 percent of its revenue from sources other than financial aid. Therefore during the year it is important to project the school’s revenue from all sources to determine that the school is in compliance with the 90-10 rule. Administrators and owners should not be surprised after the books are closed to know whether they comply with the DoE’s requirement. The 90/10 ratio is calculated as follows:
During your academic year calculate the 90/10 ratio based on budgeted revenues and actual revenues so that management understands the financial tools for compliance.
Payroll versus total expenses (KPI #6)
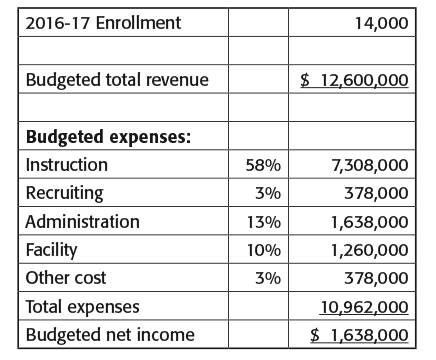
All schools should analyze operating expenses comparing information from a historical perspective with budgeted and actual amounts. Operating expenses include instructional costs (operational expenses for instruction and salaries), recruiting costs, administrative costs, and facility costs. Successful schools create benchmarks that track expenses by dividing the expense category by total revenue. Historical averages using enrollment with revenue provide benchmarks for projecting expenses over time. Here’s an example of this metric:
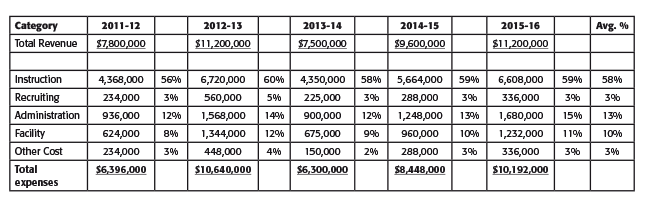
Now let’s use the historical average expense percentages for the last five years to create a baseline budget for 2016-17 as follows:
Cash flow requirements (KPI#7)
A quick and dirty calculation of cash flow can be analyzed by using the Quick or Current Ratio. The quick ratio is calculated by:
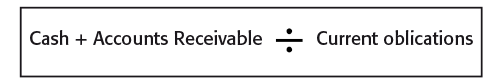
Do cash and accounts receivable exceed the amount of your current obligations?
In order to project cash flow requirements consider the following calculation:
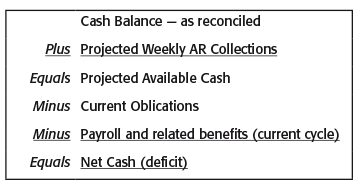
I recommend that you create a cash flow requirements report that you review semi-monthly. You can then create cash flow trends year over year.
Conclusion
Knowing what operating KPIs to use allow owners and school administrators to monitor financial activity from the 30,000 view. When owners can make management decisions using real-time data, then financial goals and objectives can be refined and maximized. Owners can be proactive instead of reactive. Remember the numbers always tell the story, it’s up to management to define the metrics that explain the trends and benchmarks they will consistently use to manage their school.

REBECCA DAVEE has been working with nonprofits for more than 30 years. She is a partner with Salmon Sims Thomas & Associates and her firm specializes in two industry sectors – career and vocational schools and tax-exempt organizations. DaVee leads the cloud outsourced accounting and CFO service sector of the firm.
Contact Information: Rebecca M. DaVee, CPA // Partner // Salmon Sims Thomas // 918-857-5685 // bdavee@sstcpa.com // http://www.sstcpa.com/ // Social Media: LinkedIn, Twitter